News
Latest updates of our fintech products, awards, interviews, media & top-tier industry publications.
cTrader Web 3.3 Adds FXStreet Economic Calendar & Autochartist
May 27, 2019

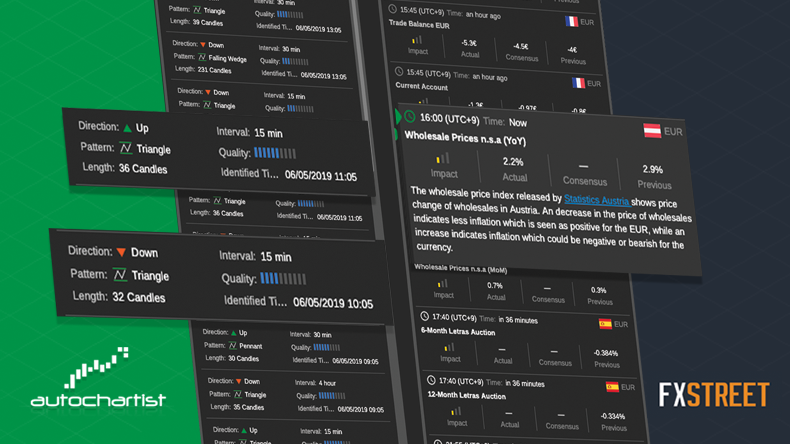
cTrader Web’s update to version 3.3 marks a whole new step in trader experience. Aside from the additional features and convenience updates, technical and fundamental analysis can now be performed directly on the platform, thanks to two newly-formed integrations with FxStreet Economic Calendar and Autochartist Market Analysis.
True to our Traders First™ approach, we have chosen these leading analytical tools to help traders make more informed trading decisions.
FXStreet Economic Calendar
In cTrader Web 3.3, the FXStreet Calendar can be accessed from a dedicated Calendar tab, or the Active Symbol Panel Order tab. Events can be filtered based on symbol and period, displaying the nearest and most volatile event per symbol.
FXStreet Economic Calendar offers thorough economic events descriptions, including time, country, volatility, actual and previous fundamental indicators, as well as market consensus and source links for an elevated fundamental analysis.
This feature is available with all brokers.
Autochartist Market Analysis
Autochartist in cTrader Web 3.3 is placed in the ASP panel Order tab, as well as in the dedicated Autochartist tab. When a pattern is clicked on, the Pattern Details window with complete information on the selected pattern appears in a pop-up format. Charts can then be opened and orders placed, directly from the window.
Autochartist uses Chart Patterns, Fibonacci Patterns, and Key Levels in order to identify trade opportunities in the market. Applicable for timeframes as low as 15 minutes, it gives traders the direction of potential price movement, along with the forecasted price and graphic results’ illustration.
This feature is available with brokers subscribed to Autochartist services.
More cTrader Web 3.3 Updates
Chart Interaction Improvements
Charts can now be moved back to the beginning, as well as dragged up and down for trend identification and technical analysis convenience.
Profitability in Analyze App
Analyze section’s existing metrics have been expanded to allow traders view analysis of their own profitability.
More Quick Settings in Top Menu
More quick settings, including Email Alerts, Quick Trade, and Hotkeys, have joined the top menu for easier access.
Favorite Symbol Button in ASP
Favorite Symbol button was placed in the Active Symbol Panel, so traders’ favorite symbols could be added to their Watchlists.
Saved Order Values per Symbol per Account
Saved Order Values have been introduced to speed up order placement. When the same symbol is selected again for order in the same account, the order details, such as Quantity/Size, Market Range, Stop Loss, Take Profit and Trailing Stop Loss will be inserted automatically as last time.
cTrader Copy 3.3 Updates
Advanced Filtering & Sorting Options of Strategies
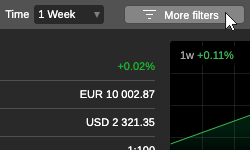
Strategies can now be filtered by age, fee type, number of copiers and copying capital. They can also be sorted by the number of copiers, copying capital and ROI.
 More Statistics in Strategy Profile
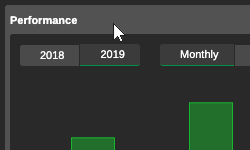
Strategy profiles have been extended with an additional section on performance which allows winning and losing trades’ filtering by days, months and years.
 Investor (Read-Only) Access to Accounts
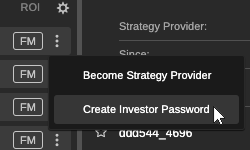
Investor (read-only) account password generation has been introduced to allow other users to view trading statistics, open positions, and histories of their providers.

The new cTrader Web 3.3 is live on Beta and will be released to brokers in the nearest time.

